Course info
- Link: https://p.ost2.fyi/courses/course-v1:OpenSecurityTraining2+Dbg1011_WinDbg1+2021_v1/course/
- Must finish Lab Setup: Visual Studio 2019
- You can find it here: https://p.ost2.fyi/courses/course-v1:OpenSecurityTraining2+Dbg1001_VS_IDE+2021_v1/course/
First
Install windbg and configure the main workflow like this
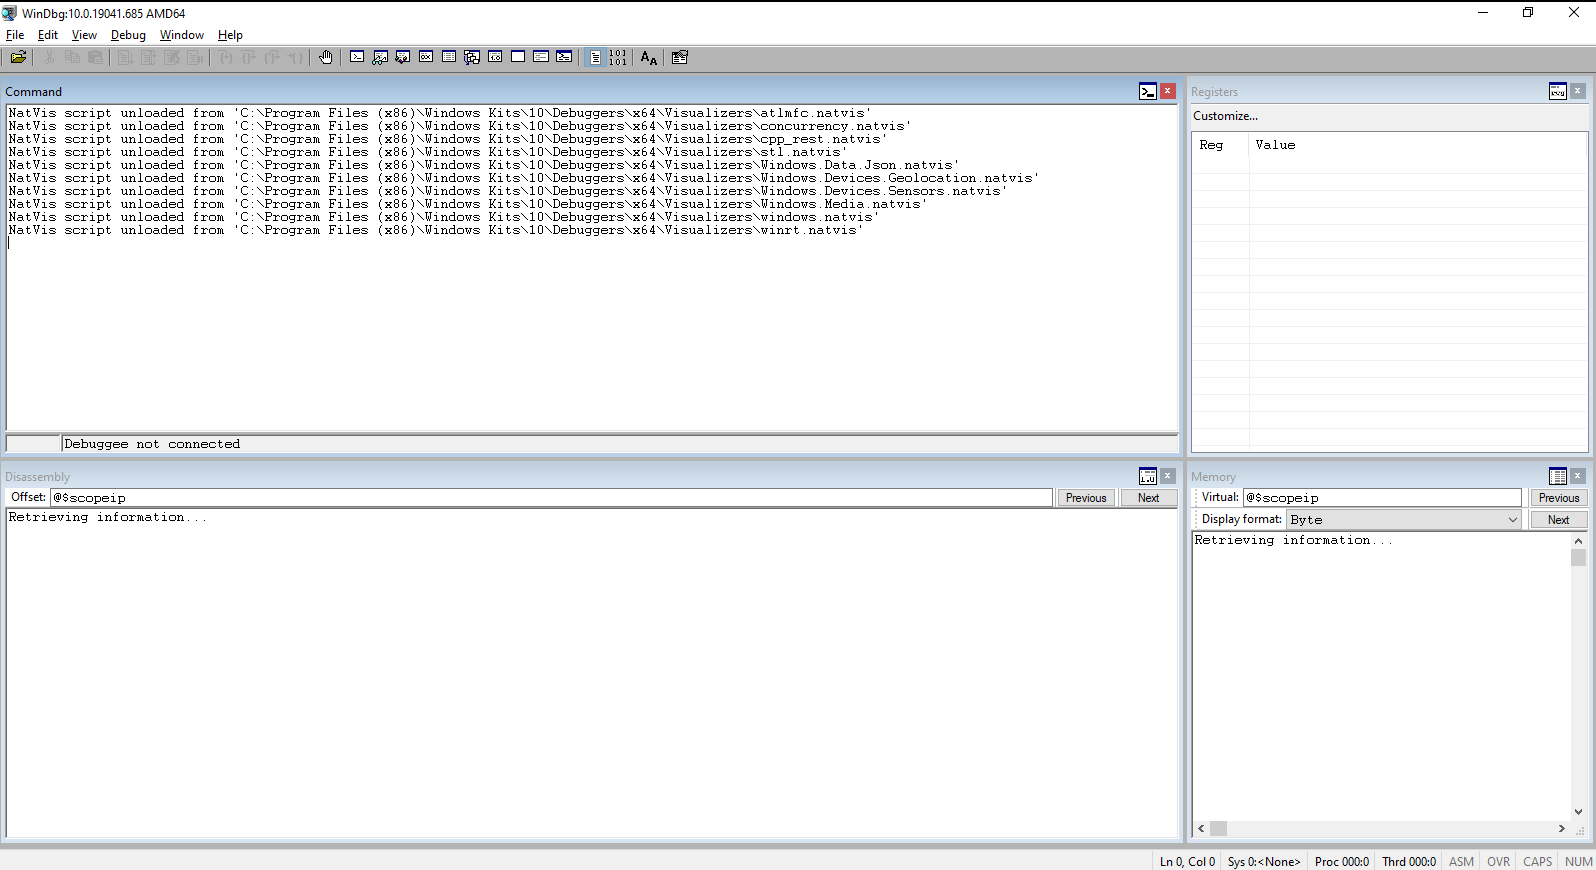
- Save the workflow, yada yada yada.
- Compile the Fibonacci example from the Lab setup
- Load and play
Loading a Binary
Loading binary from filesystem:
- Select
File -> Open Executablefrom the menu bar- or press Ctrl+e
- Navigate to the binary you want to open.
Unloading / stopping a binary (so you can load a different one):

- Hit the
Stop debuggingitem in the debug menu bar as shown below- or Select
Debug -> Stop Debugging(shortcut shift+F5) from the menu bar - or Enter
qin the command window to quit the process.
- or Select
- MS Documentation for q
Example
Running & Restarting Binaries
Continuing execution of a program stopped at a breakpoint

- Use the Go button in the tool bar as shown below
- or Select
Debug -> Go(shortcut F5) from the menu bar - or The g command in the command window will let the execution go
- or Select
- MS Documentation for go
Restarting a program

- Use the Restart button in the tool bar as shown below
- Select Debug → Restart (shortcut ctrl+shift+F5) from the menu bar
- The .restart command in the Command window will restart program execution from the beginning
- MS documentation for .restart
Code Breakpoints: Setting, Listing, and Deleting
Setting Code Breakpoints:

- Click on the source/assembly and hitting the “
Insert or remove breakpoint” button shown- Click on the source/assembly and hit shortcut F9 to insert a breakpoint
- Enter “bp <address or symbol name>” in the command window (for BreakPoint)
- MS Documentation for bp 1
- MS Documentation for bp 2
Listing Code Breakpoints:
- “bl” in the command window (for “Breakpoint List”)
- Note the numbers for each breakpoint, as those numbers will be used for other commands like the “bc” below
- MS documentation for bl
Unsetting Code Breakpoints:
bc <breakpoint number given in bl>in the command window (for Breakpoint Clear)- or clicking the “clear” link shown for a given breakpoint in the “bl” output
- MS Documentation for bc
Data Access Breakpoints: Setting Break-on-Read vs. Break-on-Write
Break On Write-Only Access
A simplified form of the break on access command is:
ba <access type> <data size> <address>
Where:
-
<access type>== w (for write-access) -
<data size>== 1, 2, 4, or 8 (bytes) -
<address>== an absolute address, symbol name, or calculation of an address like “rsp+0x24” -
So for instance to break when 4 bytes are written to address
00000000'0014fdf4, you would enter:
ba w 4 00000000`0014fdf4
- See the MS documentation for ba for the full syntax and supported forms
Break On Read-And-Write Access
- The
bainstruction does not support a break on read-only capability, because Intel hardware does not have this capability. - Some debuggers emulate this by setting both a break on read/write and a break on write, and then determining if the break must have been a read-only access. But this takes up twice as many hardware breakpoints.
- WinDbg however does not offer this capability. Therefore it is your job to determine based on the assembly instruction which the code is stopped at whether it was a read or a write.
- Therefore the syntax to set a break on read and write access is the same as the above, but with the “r” access type. I.e.:
ba r 4 00000000`0014fdf4
- See the MS documentation for ba for the full syntax and supported forms
Break On Read-Only Access
see above lol
Example
All Breakpoints: Disabling and Enabling
Disabling Breakpoints
bd <breakpoint number given in bl>in the command window- or clicking the
Disablelink in the bl output, if the breakpoint is currently enabled
- or clicking the
- MS Documentation for bd
Enabling Breakpoints:
be <breakpoint number given in bl>in the command window (for Breakpoint Enable)- or clicking the
Enablelink in the bl output if a breakpoint is currently disabled
- or clicking the
- MS documentation for be
Example
Hardware vs. Software Breakpoints
Hardware vs. Software Breakpoints on Intel Hardware
- Intel has separate concepts of a “hardware” breakpoint vs. a “software” breakpoint. It is generally possible to set an unlimited number of software breakpoints, because they take the form of a single byte “interrupt 3” (0xCC) instruction which the debugger writes into the instruction stream wherever it would like to break.
- When the interrupt occurs, it ultimately leads back to the debugger, which can update its metadata about what breakpoint fired where, rewrite the instruction stream so the original instruction can occur, update the UI for the human, and allow the execution to continue.
- On the other hand, there are a limited number (4) of dedicated Intel special purpose debug registers. These registers inform the memory management unit that it should watch for read, write, execute, or IO accesses targeted the specified addresses/IO ports.
- The
bainstructions we previously saw are actually utilizing the hardware breakpoints behind the scenes. But we only saw write or read+write breakpoints. They also support break on execute.- The advantage of a hardware break on execute is that the memory targeted may not actually be mapped into the program’s memory space yet. But if you know the address it will be at later, once it is mapped in, then you can set a breakpoint for there and the processor will alert the debugger when the breakpoint is hit.
- This is most useful when dealing with malware which has intentional dynamism to the instructions it executes, or in the kernel where different physical memory can be mapped to the same virtual memory address at different times.
Hardware Break On Execute
A simplified form of the break on access command is for breaking on execute is:
ba <access type> <data size> <address>
Where:
<access type>== e (for execute)<data size>== 1 (WinDbg mandates that the size must be 1 if the type is “e”)<address>== an absolute address, symbol name, or calculation of an address like “rsp+0x24”
So for instance to break when address 00000001'40001050 is executed, you would enter:
ba e 1 00000001`40001050
Note
You can’t set a break on access breakpoint from the system debug breakpoint where windbg stops you when you first execute a binary. Because hardware debug registers are saved and restored as part of thread state, and the thread state will be swapped out between the system debug point and the execution of the binary - thus “losing” the hardware breakpoints you may set. Instead, set a software breakpoint on $exentry (the executable entry point), and set hardware breakpoints from there.
See the MS documentation for ba for the full syntax and supported forms
Examine & Modify Registers & Memory
Viewing Registers

- Create and place a registers window as was shown in the UI setup video
- Type “r” and a comma-deliminated set of register names to print out their values. E.g.
0:000> r rax, rsp, bl, r11d
rax=0000000000000002 rsp=000000000014fe08 bl=0 r11d=14fdb0
Modifying Registers
- In the register window, double-click into the desired register and start typing to change the register contents.
- Use the same r command register syntax as viewing registers, but use an equal sign at the end to assign a value to the register. E.g.
0:000> r ax = 0xf00d, rbx = 0xdeadfacebeefd00d, bl = 0x0f
0:000> r ax, rbx, bl
ax=f00d rbx=deadfacebeefd00f bl=f
Viewing Memory

- Create and place a memory window as was shown in the UI setup video
- Utilize the d* set of commands, which display varying amounts of memory at a given address, with varying sizes.
db <address> L<number>== displays<number>bytes starting at<address>dd <address> L<number>== displays<number>doublewords (4 bytes) starting at<address>dq <address> L<number>== displays<number>quadwords (8 bytes) starting at<address>da <address>== displays as ASCII string at that address until first null terminator e.g.
0:000> db rsp L6
00000000`0014fe08  ef be ad de 01 00                                ......
0:000> dd rsp L6
00000000`0014fe08  deadbeef 11100001 00000001 0000693d
00000000`0014fe18  4b054299 00007fff
0:000> dq rsp L6
00000000`0014fe08  11100001`deadbeef 0000693d`00000001
00000000`0014fe18  00007fff`4b054299 00000000`00000000
00000000`0014fe28  00000001`40001a4d 00000000`00000001
0:000> da 00000001`40002220
00000001`40002220  "First %d elements of the Fibbona"
00000001`40002240  "cci sequence: "
- MS documentation for full d* forms
- MS documentation for the display range syntax
- MS documentation for viewing & editing memory
Modifying Memory
- Move to the desired location in a memory window , click into the window, and start typing to write values into memory at that location.
- Utilize the e* forms, similar to the d* forms, to enter values of a specific size into memory at a given address
0:000> eb rsp 0x11 0x22 0x33 0x44
0:000> db rsp L4
00000000`0014fe08  11 22 33 44                                      ."3D
0:000> ed rsp 0xdeadbeef
0:000> dd rsp L1
00000000`0014fe08  deadbeef
- MS documentation for full e* forms
- MS documentation for the display range syntax
- MS documentation for viewing & editing memory
Example
Setting Up an Updating Stack View
This can be accomplished simply by putting “rsp” into a memory window, and setting the size to “quad hex”, and adjusting the window size to only show one quadword per row, as shown in the below video.
Stack Backtrace
From GUI Window
Use the “call stack” window as shown below.

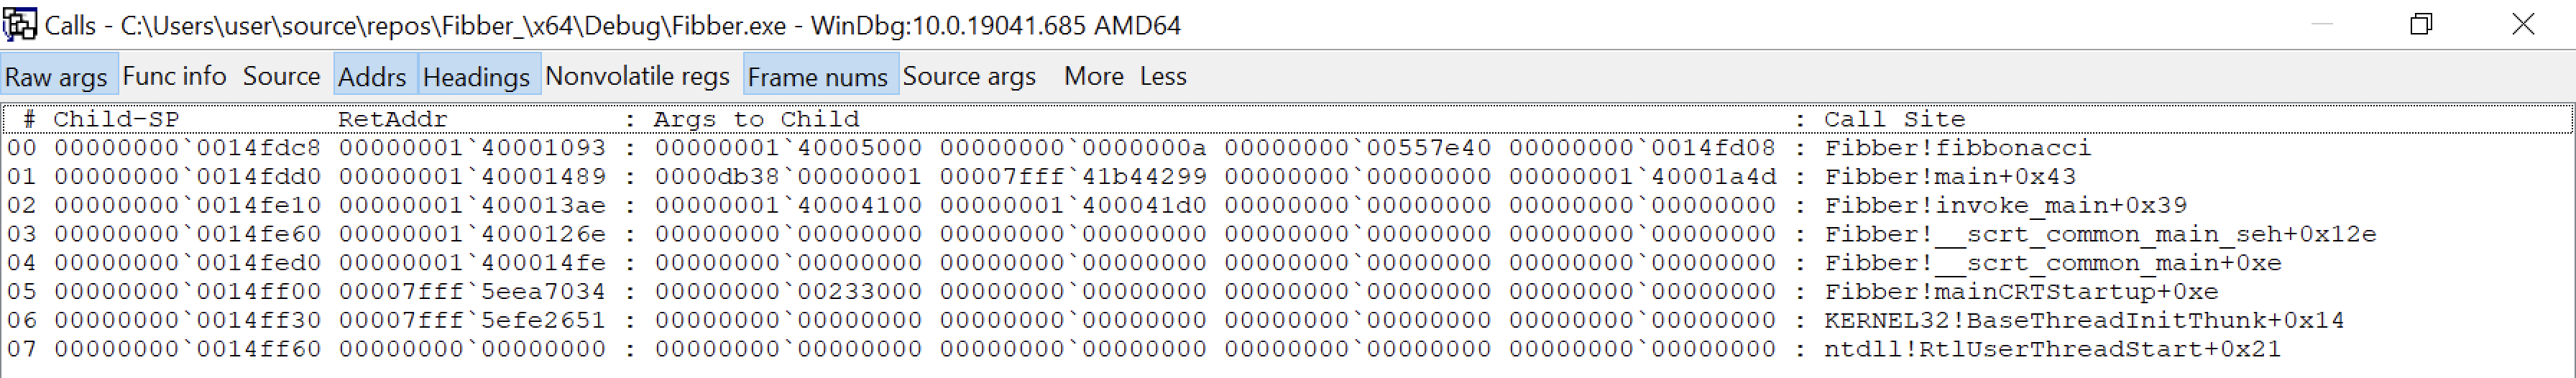
You can select additional options to be displayed once the window is open. E.g. when breaking at the entrypoint of fibbonacci() in the debug build of Fibber.exe, k yields the following output by default:
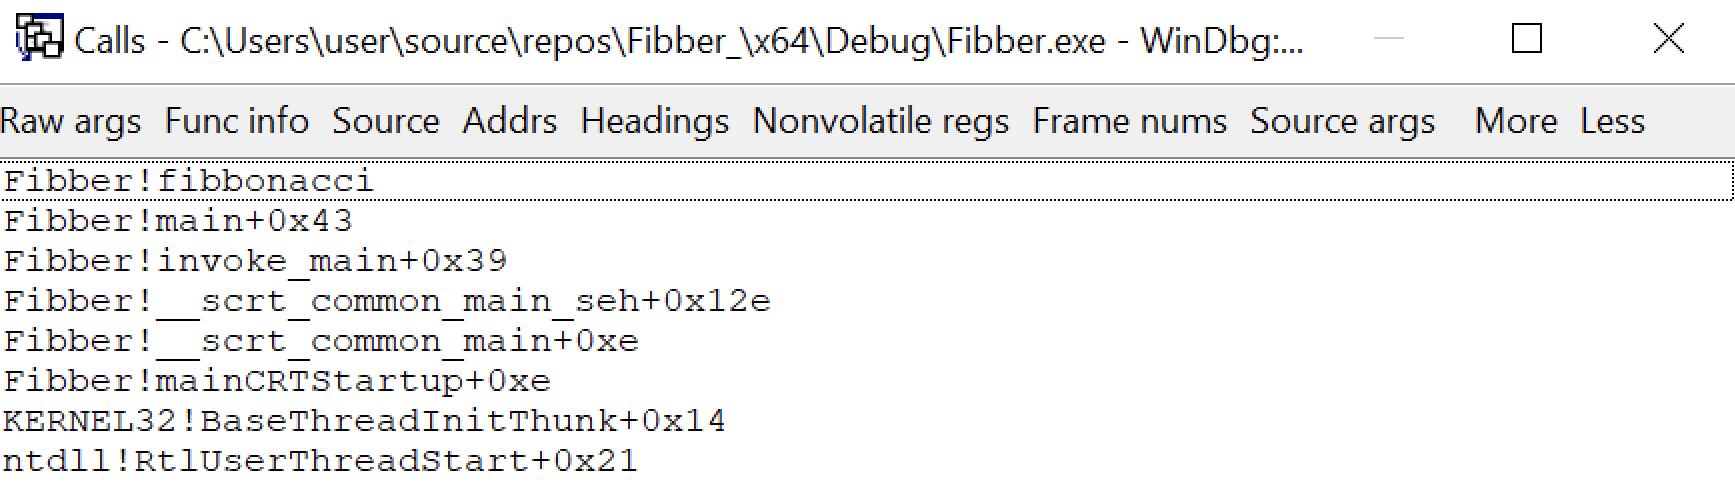
and once some options are selected, it looks like this:
MS documentation “Viewing the Call Stack in WinDbg”
From Command Window
-
Use “k” from the command window to get a stack backtrace.
-
e.g. when breaking at the entrypoint of fibbonacci() in the debug build of Fibber.exe, k yields the following output.
0:000> k

 # Child-SP          RetAddr           Call Site

00 00000000`0014fdc8 00000001`40001093 Fibber!fibbonacci [C:\Users\user\source\repos\Fibber\Fibber.c @ 3]

01 00000000`0014fdd0 00000001`40001489 Fibber!main+0x43 [C:\Users\user\source\repos\Fibber\Fibber.c @ 18]

02 00000000`0014fe10 00000001`400013ae Fibber!invoke_main+0x39 [d:\A01\_work\12\s\src\vctools\crt\vcstartup\src\startup\exe_common.inl @ 79]

03 00000000`0014fe60 00000001`4000126e Fibber!__scrt_common_main_seh+0x12e [d:\A01\_work\12\s\src\vctools\crt\vcstartup\src\startup\exe_common.inl @ 288]

04 00000000`0014fed0 00000001`400014fe Fibber!__scrt_common_main+0xe [d:\A01\_work\12\s\src\vctools\crt\vcstartup\src\startup\exe_common.inl @ 331]

05 00000000`0014ff00 00007fff`5eea7034 Fibber!mainCRTStartup+0xe [d:\A01\_work\12\s\src\vctools\crt\vcstartup\src\startup\exe_main.cpp @ 17]

06 00000000`0014ff30 00007fff`5efe2651 KERNEL32!BaseThreadInitThunk+0x14

07 00000000`0014ff60 00000000`00000000 ntdll!RtlUserThreadStart+0x21
![info] Example
Step Into vs. Step Over vs. Step Out
- ”Step over” indicates that the UI should step over call instructions - executing all instructions therein, but not showing the debugger UI as stopped until the instruction after the call instruction is reached.
- ”Step into” on the other hand will step into call instructions.
- ”Step out” will step until a function exit is reached.
Step Over

- Use the “step over” button in the tool bar as shown
- or
Use Debug -> Step Over(shortcut F10) - The
pcommand in the command window by itself will single “step over” a single instruction. - The
pcommand optionally takes a number of instructions to step forward. So “p 5” will step over 5 instructions.
- or
- MS documentation for p
- MS documentation on “controlling the target”
Step Into
- Use the “step into” button in the tool bar as shown
- or
Use Debug -> Step Into(shortcut F11 or F8) - The
tcommand in the command window by itself will trace into, or single step into, a single instruction. - The
tcommand optionally takes a number of instructions to step forward. So “t 5” will step into 5 instructions.
- or
- MS documentation for
t - MS documentation on “controlling the target”
Step Out
- Use the “step out” button in the tool bar as shown below
- or Use Debug → Step Out (shortcut shift+F11)
- or The go up (
gu) command in the command window by itself will continue execution until it steps out of the current function context (i.e. by executing a return instruction).
- MS documentation for gu
- MS documentation on “controlling the target”
Example
Temporary Code Breakpoints aka Run to Cursor
Run To Cursor
Click somewhere in the source or disassembly view and…
- Click the Run To Cursor button shown below:

- Or select
Debug -> Run to Cursor(shortcuts ctrl+F10 or F7) - MS documentation on “controlling the target”
Step To Address:
- “
pa <address or symbol name>” in the command window (for step to address) - This instruction will print out every instruction it steps over on its way to that address.
- MS documentation for pa
- MS documentation on “controlling the target”
Trace To Address:
- “
ta <address or symbol name>” in the command window (for trace to address) - This instruction will print out every instruction it steps into (including subroutine addresses) on its way to that address.
- MS documentation for ta
- MS documentation on “controlling the target”
The /1 Argument to Breakpoint Commands
- If you pass a
/1argument tobporba, it “Creates a “one-shot” breakpoint. After this breakpoint is triggered, it is deleted from the breakpoint list.” - MS documentation for
bp - MS documentation for
ba
Example
Attaching to Running Userspace Processes
- Use
File -> Attach to a Process(shortcut F6) - Then select the process to attach to, or specify a process ID (PID)
- After you do this, the debugger will break within the process. You can then examine the stack backtrace, or registers and memory with the previously taught commands. Or you can set breakpoints if you know where you want to break.
- You can use “
go” to continue execution, and the “Break” icon (shortcut ctrl+break) as shown below
Example
End
- Special thanks to Xeno Kovah for making the resources and the course freely available.
- All of the notes written here are just trimmed down version of the materials provided by the course itself. If anyone stumble upon this, please take it instead of just using this alone.
- Pleas take the course lmao it’s pretty short